
Project: epiphany machine
epiphany machine (2024) is a neuroballet for two subjects using live electroencephalography (EEG) to visualize the brain activity of dancers in a variety of performance states. Traditionally, the brain has been studied in stillness, but recent advances in Mobile Brain Body Imaging (MoBI) have enhanced our ability to study the moving brain of not only one but two or more individuals during interactive experiences. The resulting piece is a hybrid performance event, existing as both a concert work of dance and as a scientific study into the effects of dance on brain activity. It is an interdisciplinary, collaborative investigation into livestreaming and visualize the brain activity of dancers in a variety of choreographic tasks including meditative states with the eyes closed (affecting alpha oscillations), repetitive choreographic states (affecting beta oscillations), and spatial improvisations (affecting theta oscillations).
subjects & research team
Subject 1: Julia BassoSubject 2: Scotty HardwigCodebase [EEG livestream]: Noor Tasnim, Benjamin BeiterData Visualization: Zach DuerNeuroscientists: Julia Basso, Daniel EnglishSoundscape & Prompts: Scotty HardwigMusic for Trial 1: J.S. Bach research sponsor & funding: The Institute for Creativity, Arts and Technology at Virginia Techspecial thanks to: Kyle Hutchinsthe three sections of epiphany machine
i. “alpha meditations”
Data. For the first ten minutes, we are recording from 3 EEG channels located at the back of the skull. These channels, termed O1, Oz, and O2, measure activity from what is known as the occipital region or occipital cortex (Brodmann’s areas 17 and 18, primary and secondary visual cortex). The occipital cortex is involved in processing visual input from the eyes (the retina), with these areas being known as visual association areas. We are therefore recording the part of the brain that is involved in feature extraction or the initial stages of visual recognition. These areas help to shape the subjects’ perceptions of the visual world.
What we are visualizing here is an EEG frequency known as the alpha wave or oscillation. The alpha wave oscillates between 8 to 12 Hertz or times per second (10 Hz on average). The alpha wave was the first brain oscillation to be discovered (thus the naming of this oscillation as alpha). It is historically known as the Berger wave named after its founder Hans Berger (and inventor of the EEG) and is the most dominant frequency in the human brain. The alpha oscillation is most prominently visualized in the occipital region (which is why we chose these electrodes to visualize alpha activity), with amplitude increasing upon closing of the eyes. Historically it was thought that the alpha wave indicates an idle or resting brain, but newer research supports the idea that alpha waves inhibit areas of the cortex not in use. In fact, they can be seen in sensorimotor areas in the absence of movement as well as in auditory areas in the absence of sound. That is, the alpha rhythm indicates an unperturbed state of mind – unbothered by the external world (the alpha rhythm is thought to emerge via input from thalamo-cortical projections). Interestingly, the amplitude or power of the alpha wave increases during meditative states – when the body is often focused on internal rather than external stimuli.
Visualization. Gathering total alpha power from each subject, and representing total power as a fractal. Higher alpha power correlates to faster fractal growth.
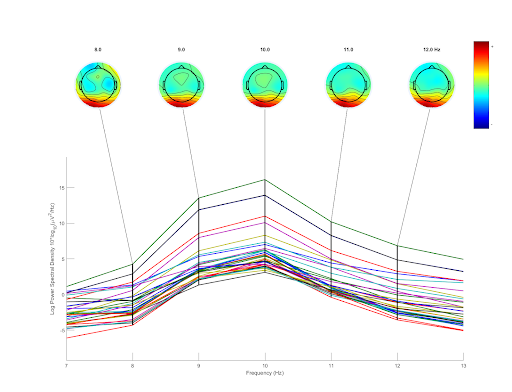
Power spectral density plots for alpha activity (heat maps presented at 8, 9, 10, 11, and 12 Hz)

Subject 1
Subject 2
ii. “beta synchronization”
Data. For the second ten minutes, instead of focusing on a few select channels, we are exploring the entire landscape of the cerebral cortex, including areas that process sensory and motor information, auditory and visual information, learning and memory, and higher level cognitive functions. The cerebral cortex is made up of 6-layers, primarily composed of pyramidal neurons named for the pyramidal shape of their cell bodies. These cells sit perpendicular to the skull’s surface, producing the sinusoidal waveforms presented on either side of the subjects.
What we are visualizing here is an EEG frequency known as the beta wave or oscillation. The beta wave oscillates between 12 to 30 Hertz or times per second. Beta waves are generally associated with normal waking consciousness, when individuals are engaged in tasks requiring focused attention, concentration, or active problem-solving. Beta oscillations also play a role in motor control and movement execution. They are particularly prominent during sensorimotor integration, voluntary muscle movements, and motor planning. Beta activity often decreases just prior to the initiation of movement and increases again during sustained muscle contractions, facilitating smooth and precise movements. In this particular experimental setup, where the subjects go in and out of coordinated movement, we are seeking to explore if and when their beta activity becomes synchronized - a process known as interbrain synchrony. This phenomenon is thought to underlie social connection or the ability to connect with others on a socio-emotional level.
Visualization. Tracking raw voltage recordings from the electroencephalography signal from each subject and presenting in black curvilinear representations. Then gathering total beta power from each subject, and representing higher beta levels as a change in color.
Power spectral density plots for beta activity. (heat maps presented at 12, 17, 22, 27, and 32 Hz)

Subject 1

Subject 2
iii. “theta waltz”
Data. For the last ten minutes, we are recording from 4 EEG channels located at the front of the skull. These channels, termed F3, F4, F7, and F8, measure activity from what is known as the frontal cortex (Brodmann’s areas 8, 45, and 47, frontal cortex). The frontal cortex is the evolutionarily newest part of the cerebral cortex and is involved in higher level cognitive functioning, with these areas being first identified by their homogenous cytoarchitectural characteristics (observed in cadavers). Here we are recording the part of the brain that is involved in executive functioning or our ability to plan and prioritize, focus and attend, manage our time, initiate tasks, and control our impulses. These areas help to shape the subjects’ ability to navigate the complex world around them.
What we are visualizing here is an EEG frequency known as the theta wave or oscillation. The theta wave oscillates between 4 to 8 Hertz or times per second (6 Hz on average). The theta wave was first discovered in the 1930s while recording the hippocampus of the anesthetized rabbit. The theta oscillation is most prominently visualized in the hippocampal region, which is then projected to the prefrontal cortex (the area from which we are recording). Scientists can only record the electrical activity of the hippocampus by inserting electrodes into the brain - impossible in this experimental setup. Historically the theta wave was thought to underlie a variety of behaviors including processing of environmental input, motor output, hypnosis, brain pulsation, temperature change, or sexual behavior. However, it is now understood that the theta wave underlies our ability to spatially navigate our environment and understand where our body is located in time and space. During theta activity, the brain is bathed in a neurotransmitter called acetylcholine, which promotes neural plasticity or the brain’s capacity to grow and change. Thus, the theta activity now being recorded promotes the subjects’ ability to learn and remember new information.
Visualization. Gathering total theta power from each subject, and represented as the growth of Perlin noise patterns. When one subject’s theta values are higher, their landscape grows - when lower, the landscape recedes.
Power spectral density plots for theta activity. (heat maps presented at 4, 5, 6, 7, and 8 Hz)

Subject 1

Subject 2